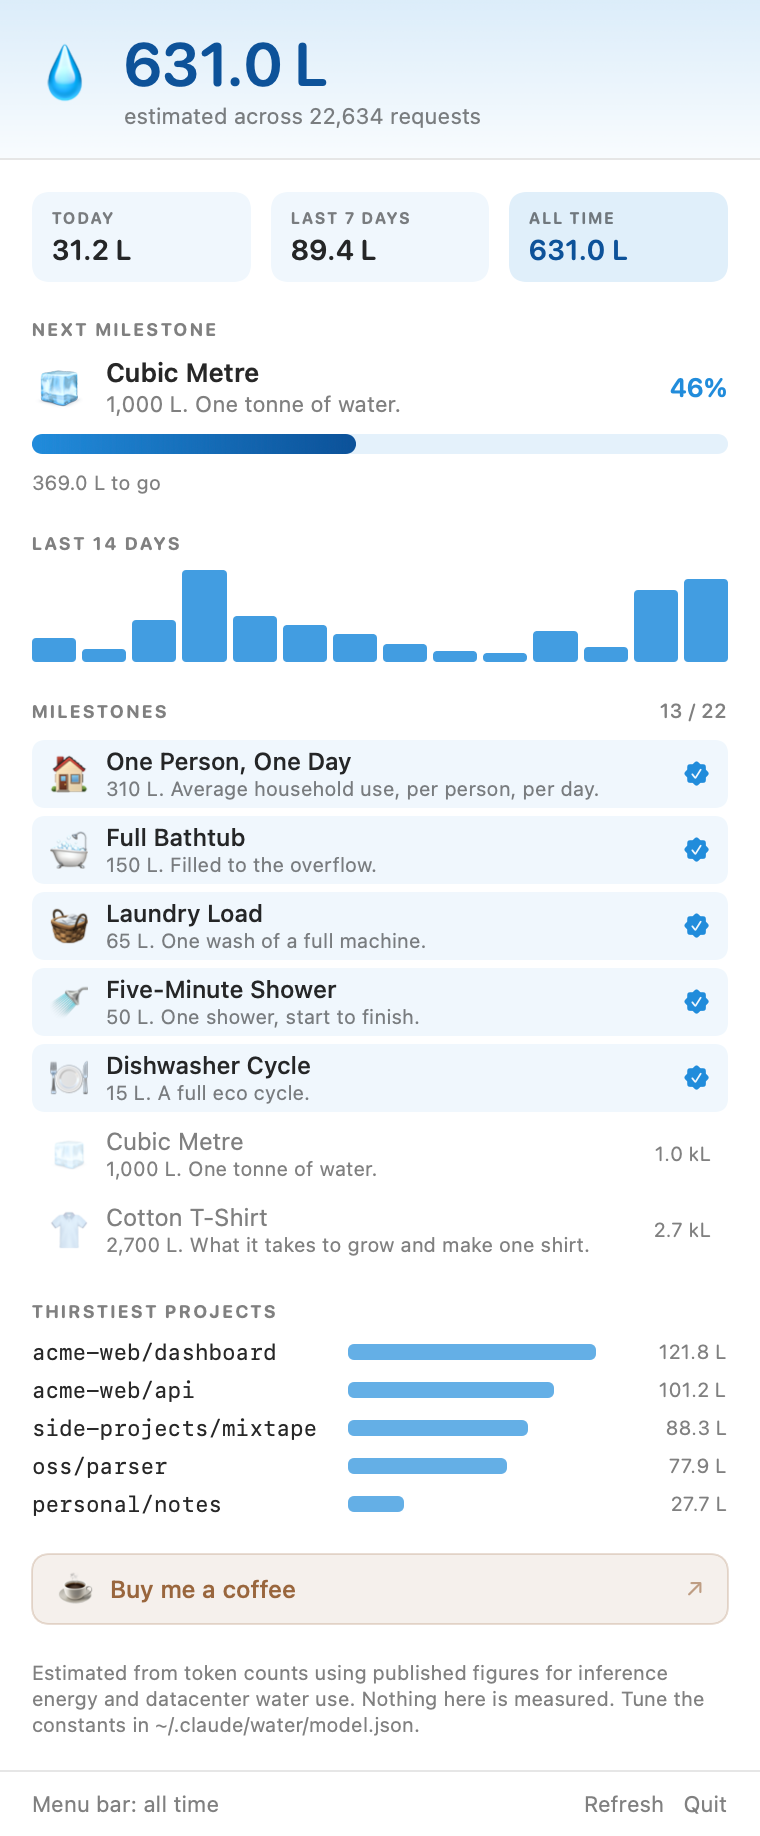
Claude Code says Pondering… while it works. WaterBar replaces that with an estimate of the water the request is drinking — and keeps a running total in your menu bar, with milestones to unlock.
Free and open source · macOS 13+ · Apple silicon & Intel · No account, no network

What it does
Every Claude Code request has a token count. WaterBar turns that into millilitres, adds it up, and puts the number where you'll actually see it.
The thinking verb becomes Evaporating 22 mL. It updates after every request, using what the last one actually cost.
From your first millilitre to an Olympic swimming pool. Each one arrives as a notification, whether or not you wanted to know.
A 14-day chart, your thirstiest projects, and a breakdown by model — Opus costs a great deal more than Haiku.
It reads the transcripts Claude Code already writes to your disk. The app links no networking frameworks at all — it cannot phone anywhere.
The whole model lives in one editable JSON file. Think the numbers are wrong? Change them and rebuild the totals.
First launch prices every session you've ever run. And the ledger is append-only, so old totals survive Claude Code's transcript cleanup.
Install
Clears the quarantine flag for you, so there's no Gatekeeper detour at all.
brew install --cask bmoresca/tap/waterbar
Drag WaterBar to Applications. Because the app is ad-hoc signed rather than notarized, macOS blocks it the first time.
On macOS 15 Sequoia and later, open System Settings → Privacy & Security, scroll to Security, and click Open Anyway. Apple removed the old Control-click shortcut in Sequoia. On macOS 13–14, Control-click the app → Open → Open. Once, not every launch.
WaterBar refreshes the spinner on its own every 20 seconds. The plugin does it
the instant a request lands, and adds /water for a full report.
/plugin marketplace add https://github.com/bmoresca/waterbar
Achievements
Cumulative, across every project. They unlock quietly and arrive as a notification.
The numbers
Anthropic doesn't publish per-request water use, and if it did the figure would move with the datacenter, the season and the grid. Nothing here is measured. What WaterBar does is apply a transparent chain of published constants to a token count:
tokens → watt-hours → kWh (× PUE) → litres (× on-site cooling + grid water)
| Constant | Default | Where it comes from |
|---|---|---|
| Opus, output tokens | 3.00 Wh / 1k | Scaled from the anchors below |
| Sonnet, output tokens | 1.10 Wh / 1k | ″ |
| Haiku, output tokens | 0.30 Wh / 1k | ″ |
| Input tokens | ~1/30th of output | Prefill is one parallel pass; each output token is its own forward pass |
| Cache reads | ~1/200th of output | The KV state already exists; it only has to move |
| Datacenter PUE | 1.10 | Typical hyperscale overhead |
| On-site cooling | 1.80 L / kWh | US datacenter water use efficiency |
| Grid electricity | 3.10 L / kWh | Water spent generating the power itself |
Those defaults were fitted between two public anchors. Google (2025) put the median Gemini text prompt at roughly 0.24 Wh and 0.26 mL — a small, heavily optimised model on a short prompt. Li et al. (2023), “Making AI Less Thirsty”, put GPT-3-scale inference nearer 500 mL per 10–50 responses.
A heavy agentic Opus turn lands around 20–30 mL. If you think
that's wrong, it probably is — every constant is in
~/.claude/water/model.json, and WaterBar rebuild re-totals from them.